LT Connect
UI, Interaction Design

Summary
- Simplified UI for users to track live workout data in class and training settings.
- Streamlined instructor app flow for better class setup, participant onboarding and session management.
Background
In its most basic form a room lined with mirrors provides great workout feedback, but what happens when you want to know more about what your body is experiencing or what pushing 250 watts on a stationary bike feels like? Similarly, being greeted as you enter a fitness class or training session is welcoming and engaging, but what if that instructor was aware you were even coming in the first place, or what equipment you preferred? How much better would you be served then?
These were the questions we were asking ourselves as we looked to create a more holistic and robust fitness experience for several of Life Time’s classes and training sessions. With an enhanced visual layer we could better coach and educate participants. At the same time we could operationally compliment instructor and trainer efforts, allowing them to focus more on the students and less on the technology and equipment.
Objective
Enhance class and session experiences with real-time visual feedback and integrated tools. Instructors and trainers need to efficiently check-in and manage participants and equipment. And once in session, users should only need a glance to understand and react to key data points.
Method
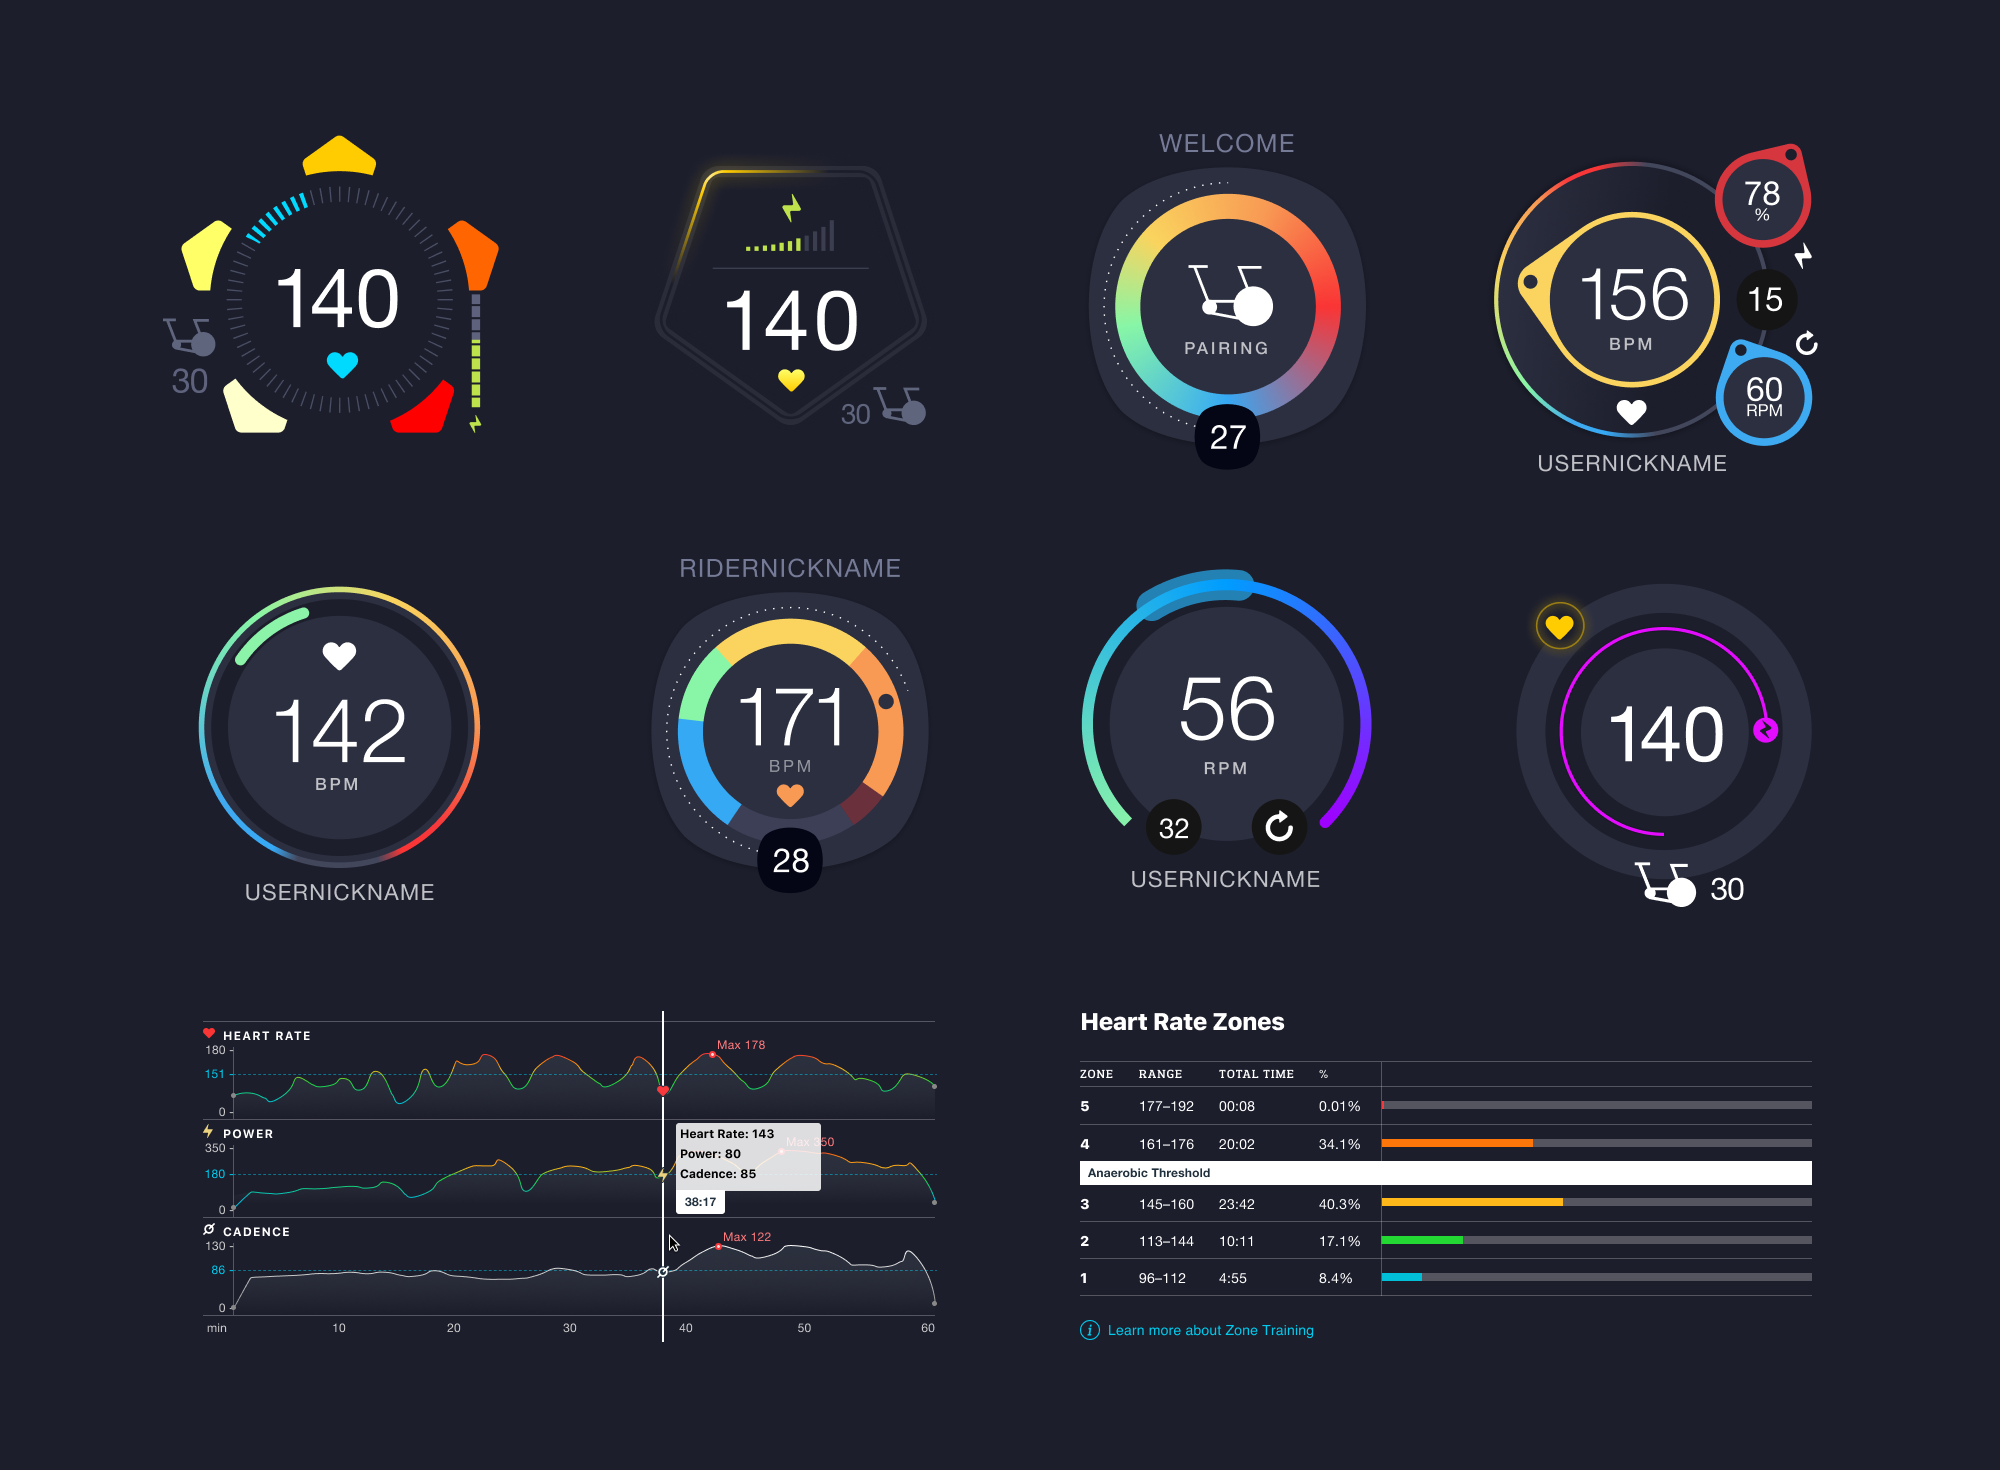
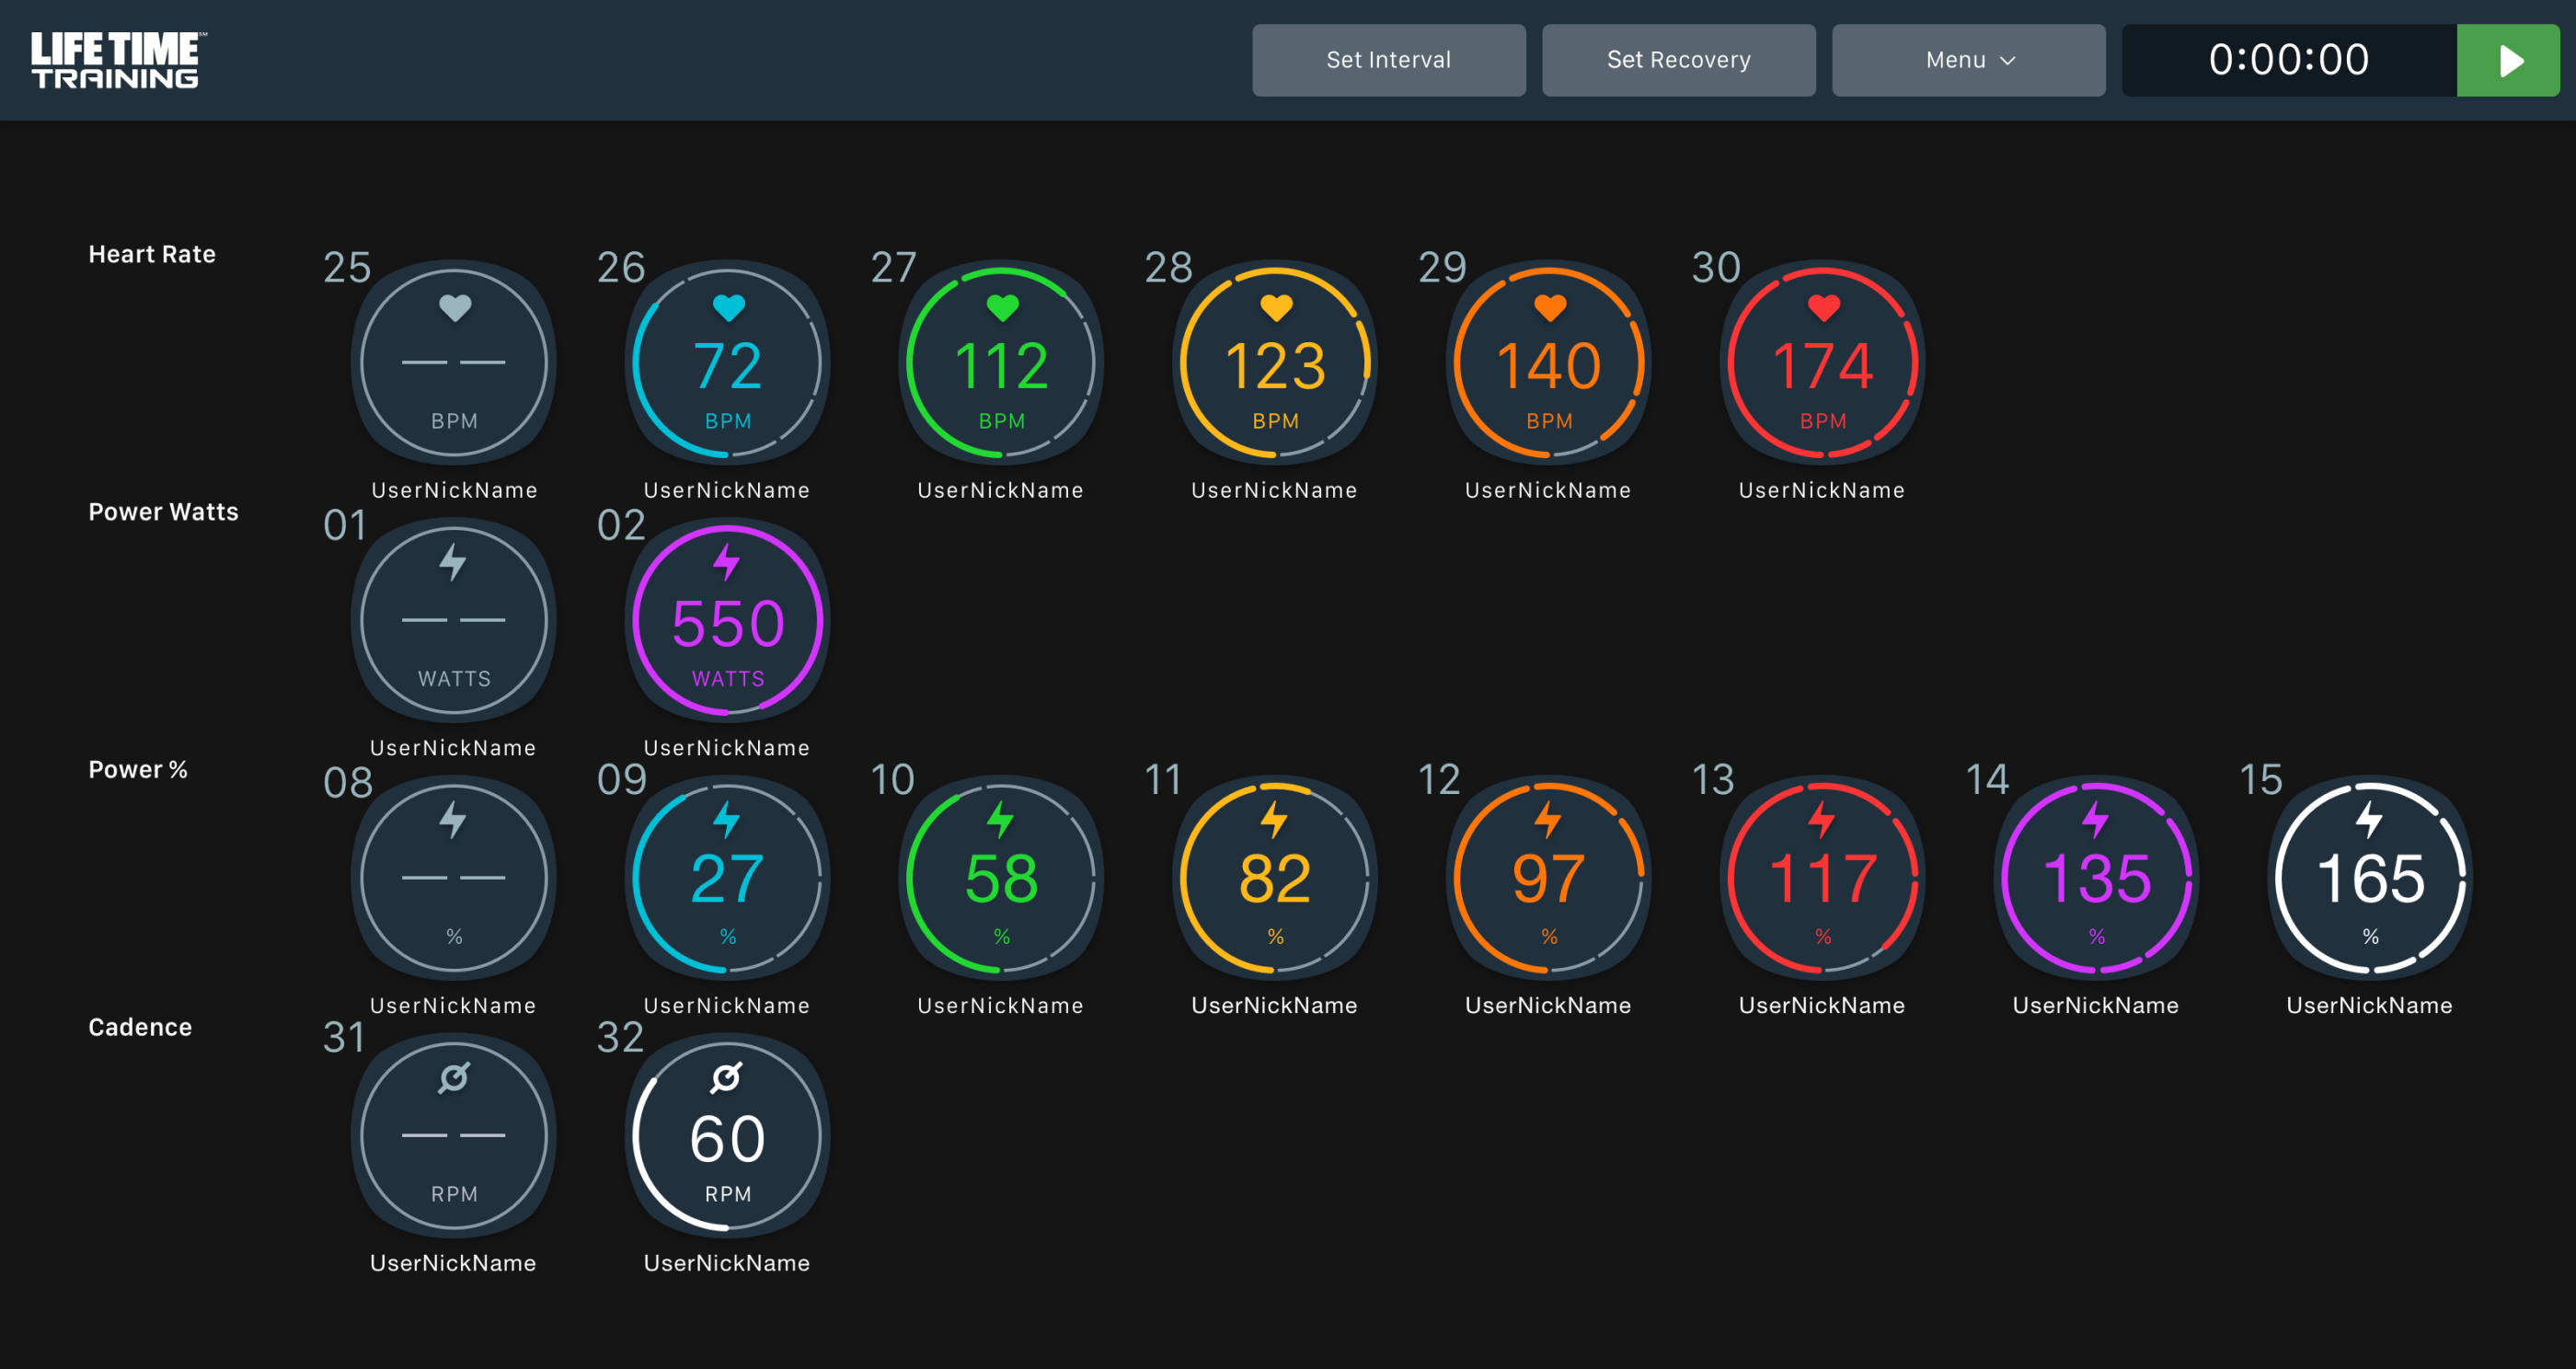
For the gauges I normalized the data points that someone is coached to, like heart rate, cadence or power, and took into account the environments in which the gauges would be used and displayed. This allowed me to create a simple system that leveraged icons and color as differentiators. With less attributes a user can be more focused on the data point and not distracted by peripheral changes. At the same time this is also more performant when a large group of real-time gauges are persent and constantly updating.
With over 139 clubs and physical settings that range from brightly lit fitness floors to dim class and cycling studios there was plenty of display variability. Someone could be in the front or back of a room, or standing under or across from a suspended monitor while anywhere from 1 to 60 individuals could have data displayed at a given time. All of this had to be taken into account and tested.
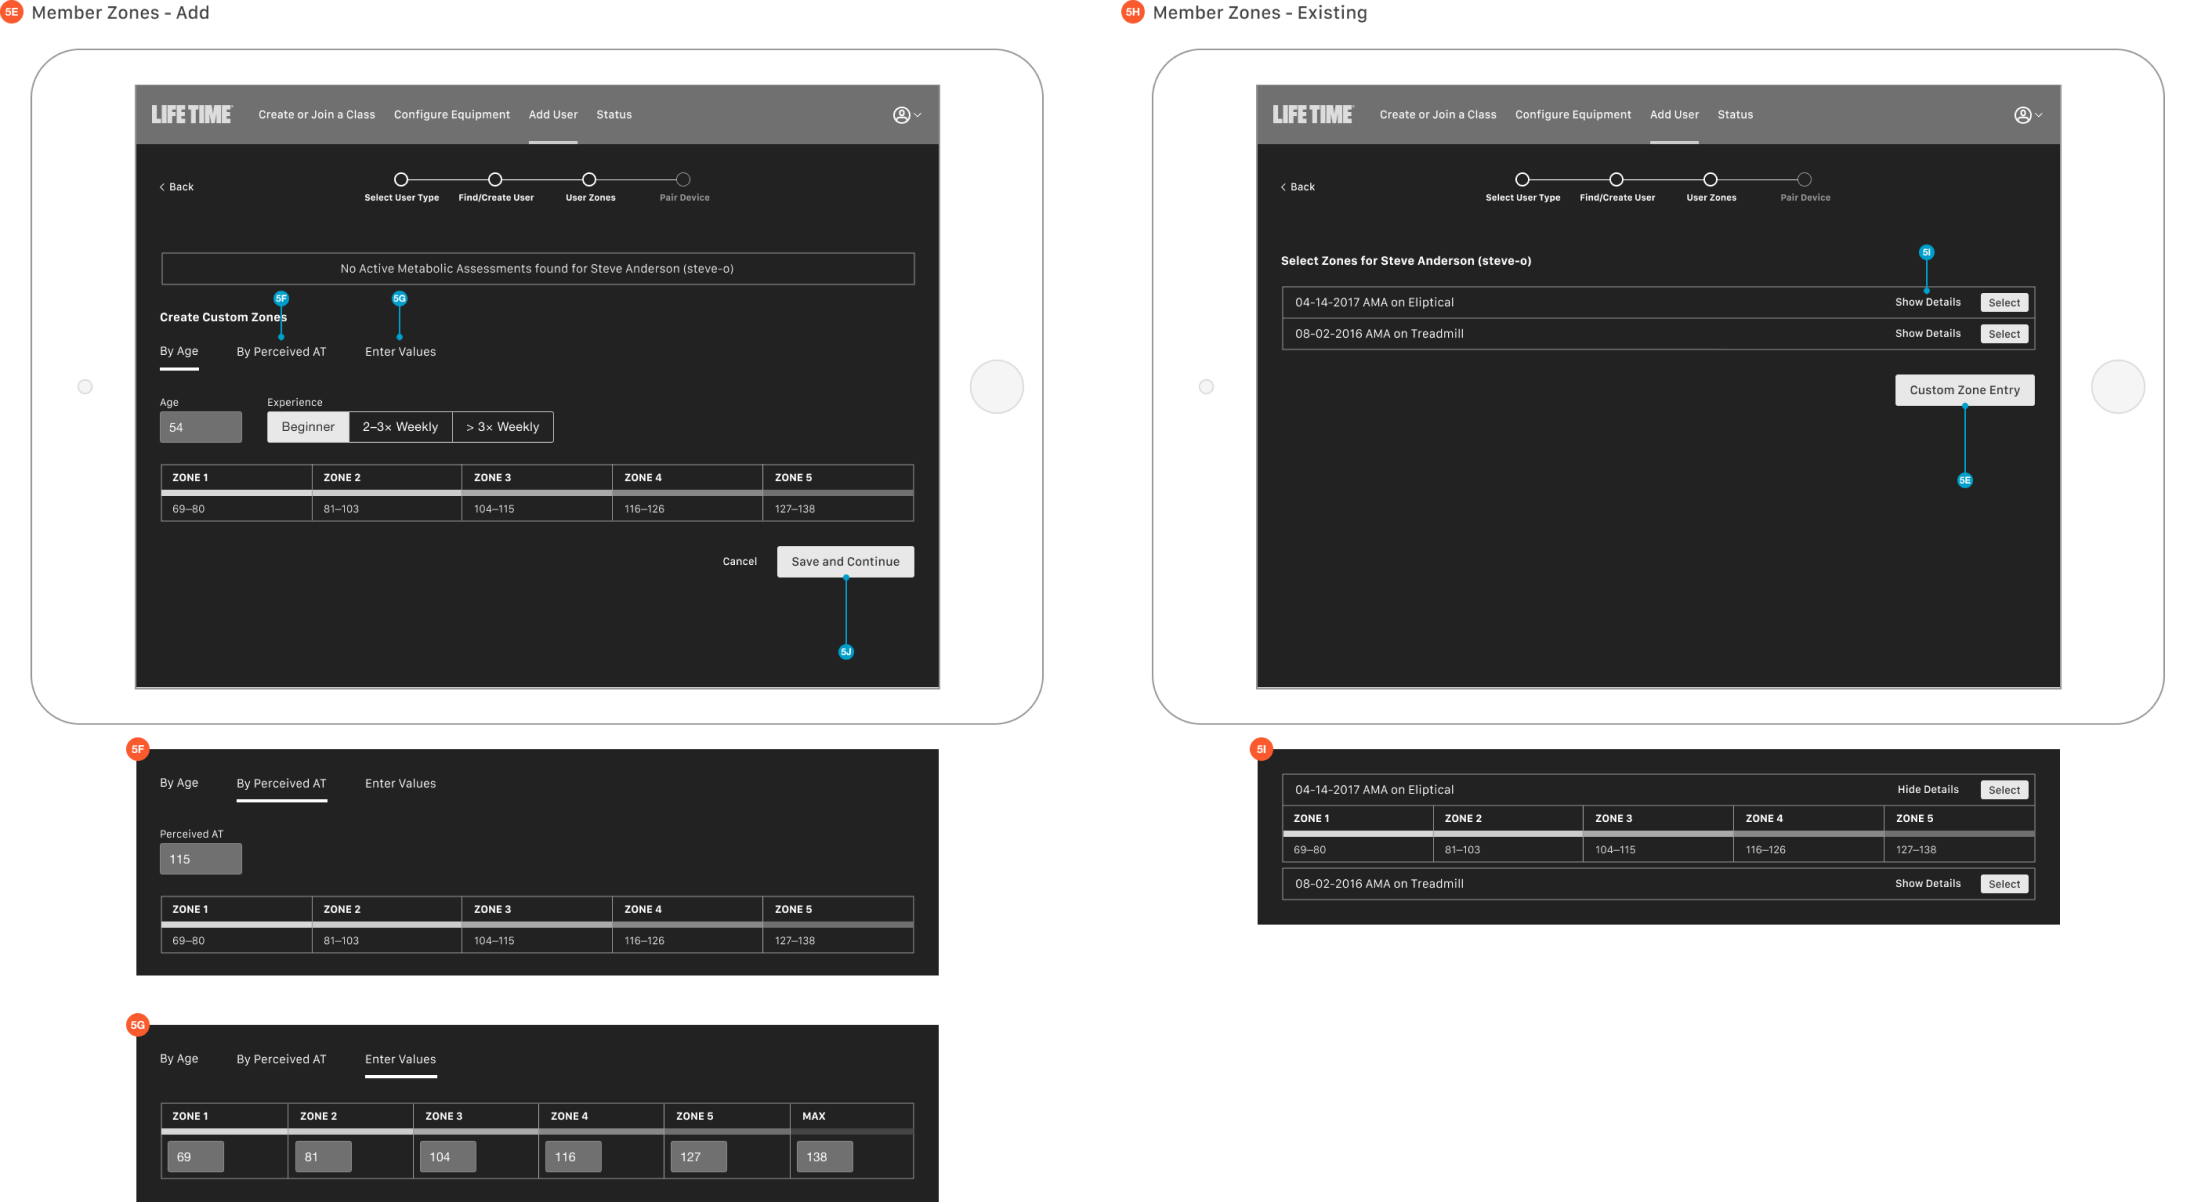
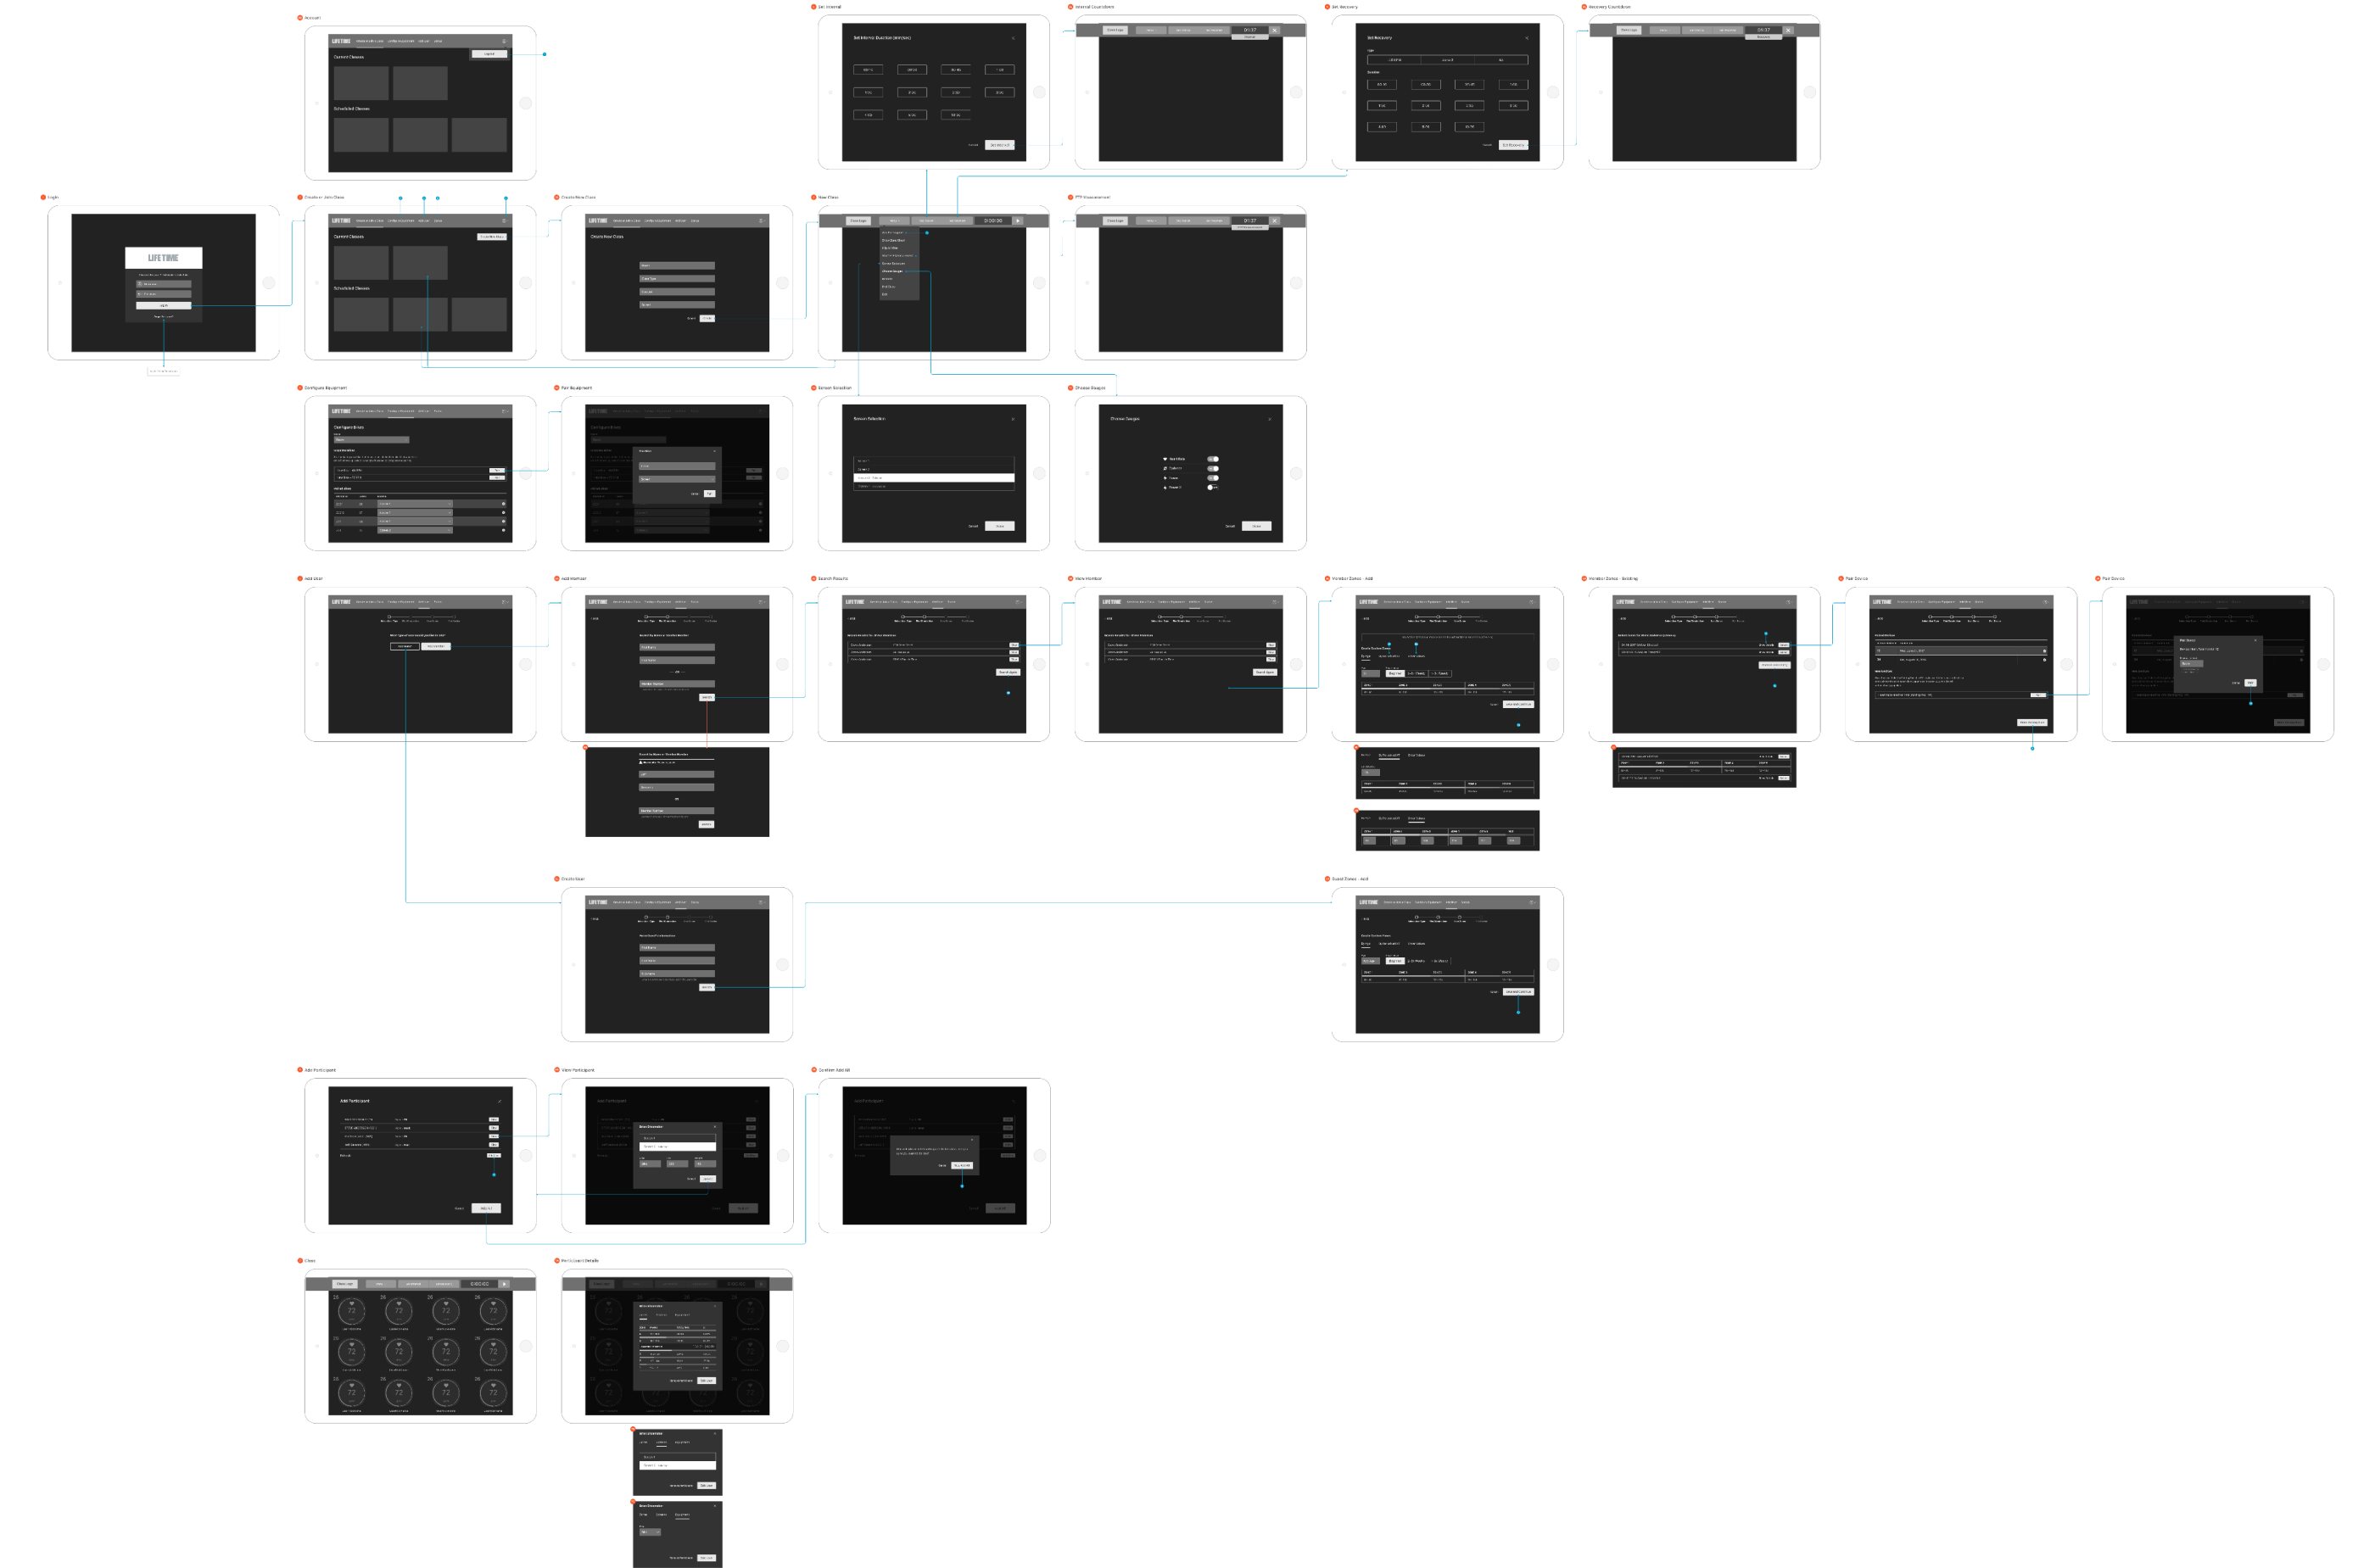
For the instructor app I opted to go with a dark theme given that in most cases it would be used in a dimly lit studio. After understanding the full task set I was able to wireframe a complete set of screens and organize them into a flow.
Outcomes
In the end one of the most simple gauge designs was implemented. It's not distracting or overwhelming when there are many on a single screen. It's versatile for any display or data point and it emphasizes what you need to know while providing a great foundation to build on.
The app has yet to be developed, however the current state allows us to better understand instructor scenarios and to set a north star for further operational alignment.